SimpleFly
SimpleFly is a simple flight moving map and navigation app for Android devices. It gives your location, speed, altitiude, and bearing, it shows ADS-B aggregated data, and provides electronic conspicuity on ADS-IP. It is completely free software (no paying for upgrades, no adds) and the download link is below.
Yes, there are many moving map apps for flight navigation, but as the name implies this one is without all of the cumbersome whistle and bells. When flying VFR in a small aircraft or ultralight, you typically only need a some basic positional information and a way to navigate from point A to point B. Everything else adds to the pilot workload, and this can be a bad thing in a stressful situation.
README
You should read the following instructions first!
There is no TL;DR video, this is not that kind of website. This is Old-School.
Class is in session, here we go...
Getting Started
When the app is opened:
- It starts the GPS.
- It opens the main Flight Display.
For this to work, you will need to give the app permission to your location. If you do not, it will show the ocean off of the coast of Africa (At Latitude 0, Longitude 0).
Displays
The Flight Display (on the left) and Navigation Display (on the right):
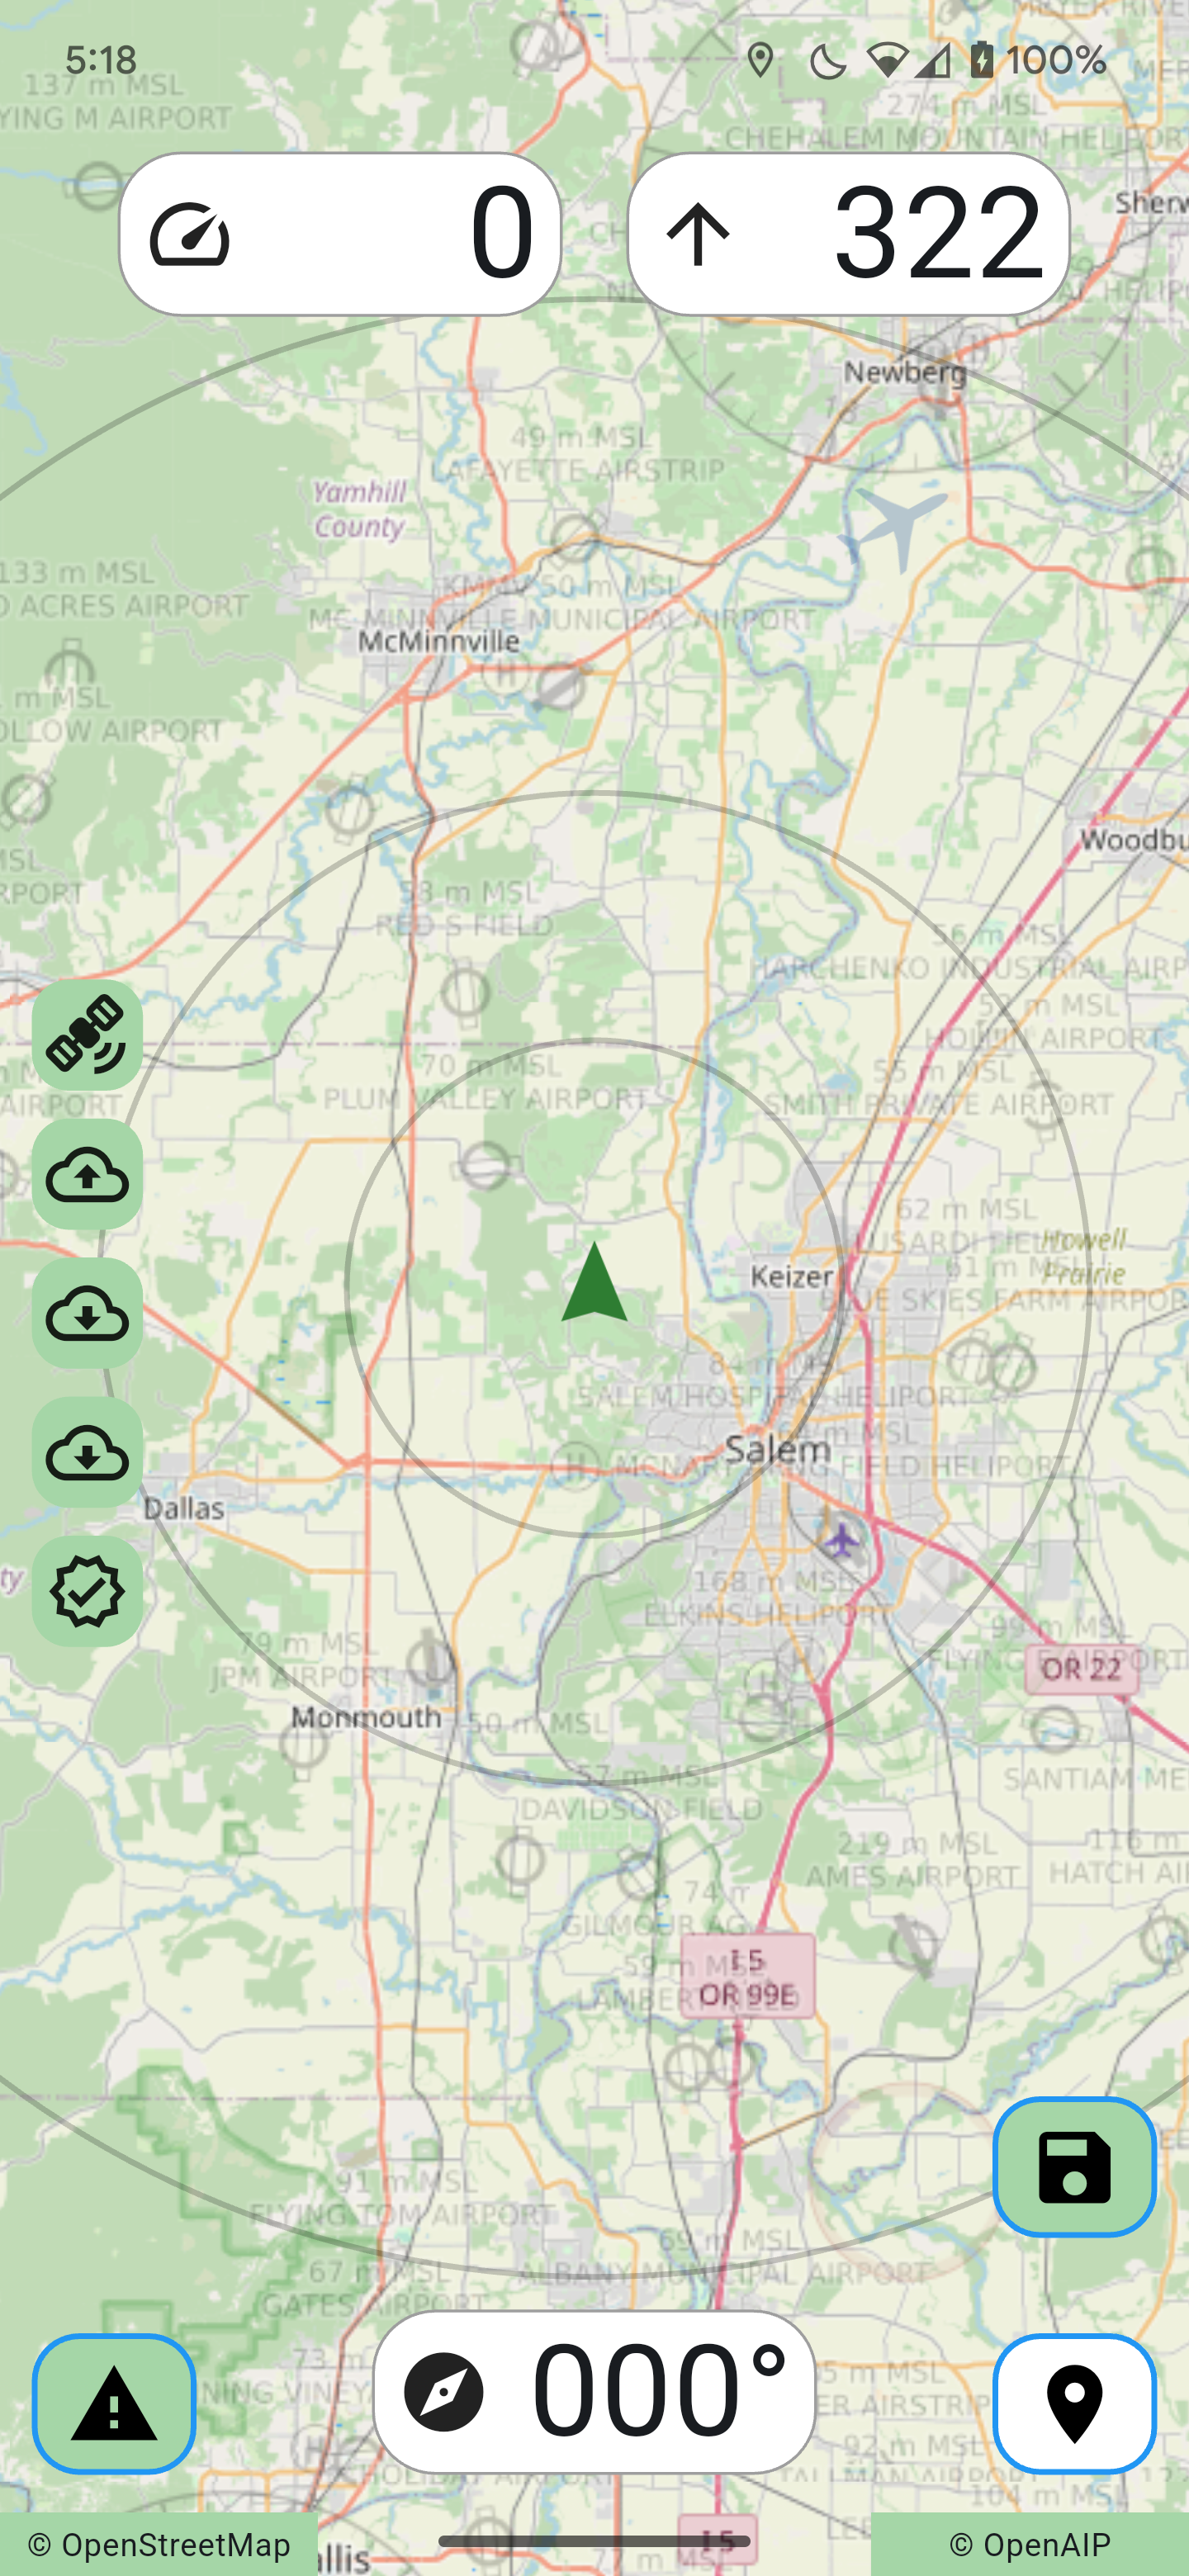
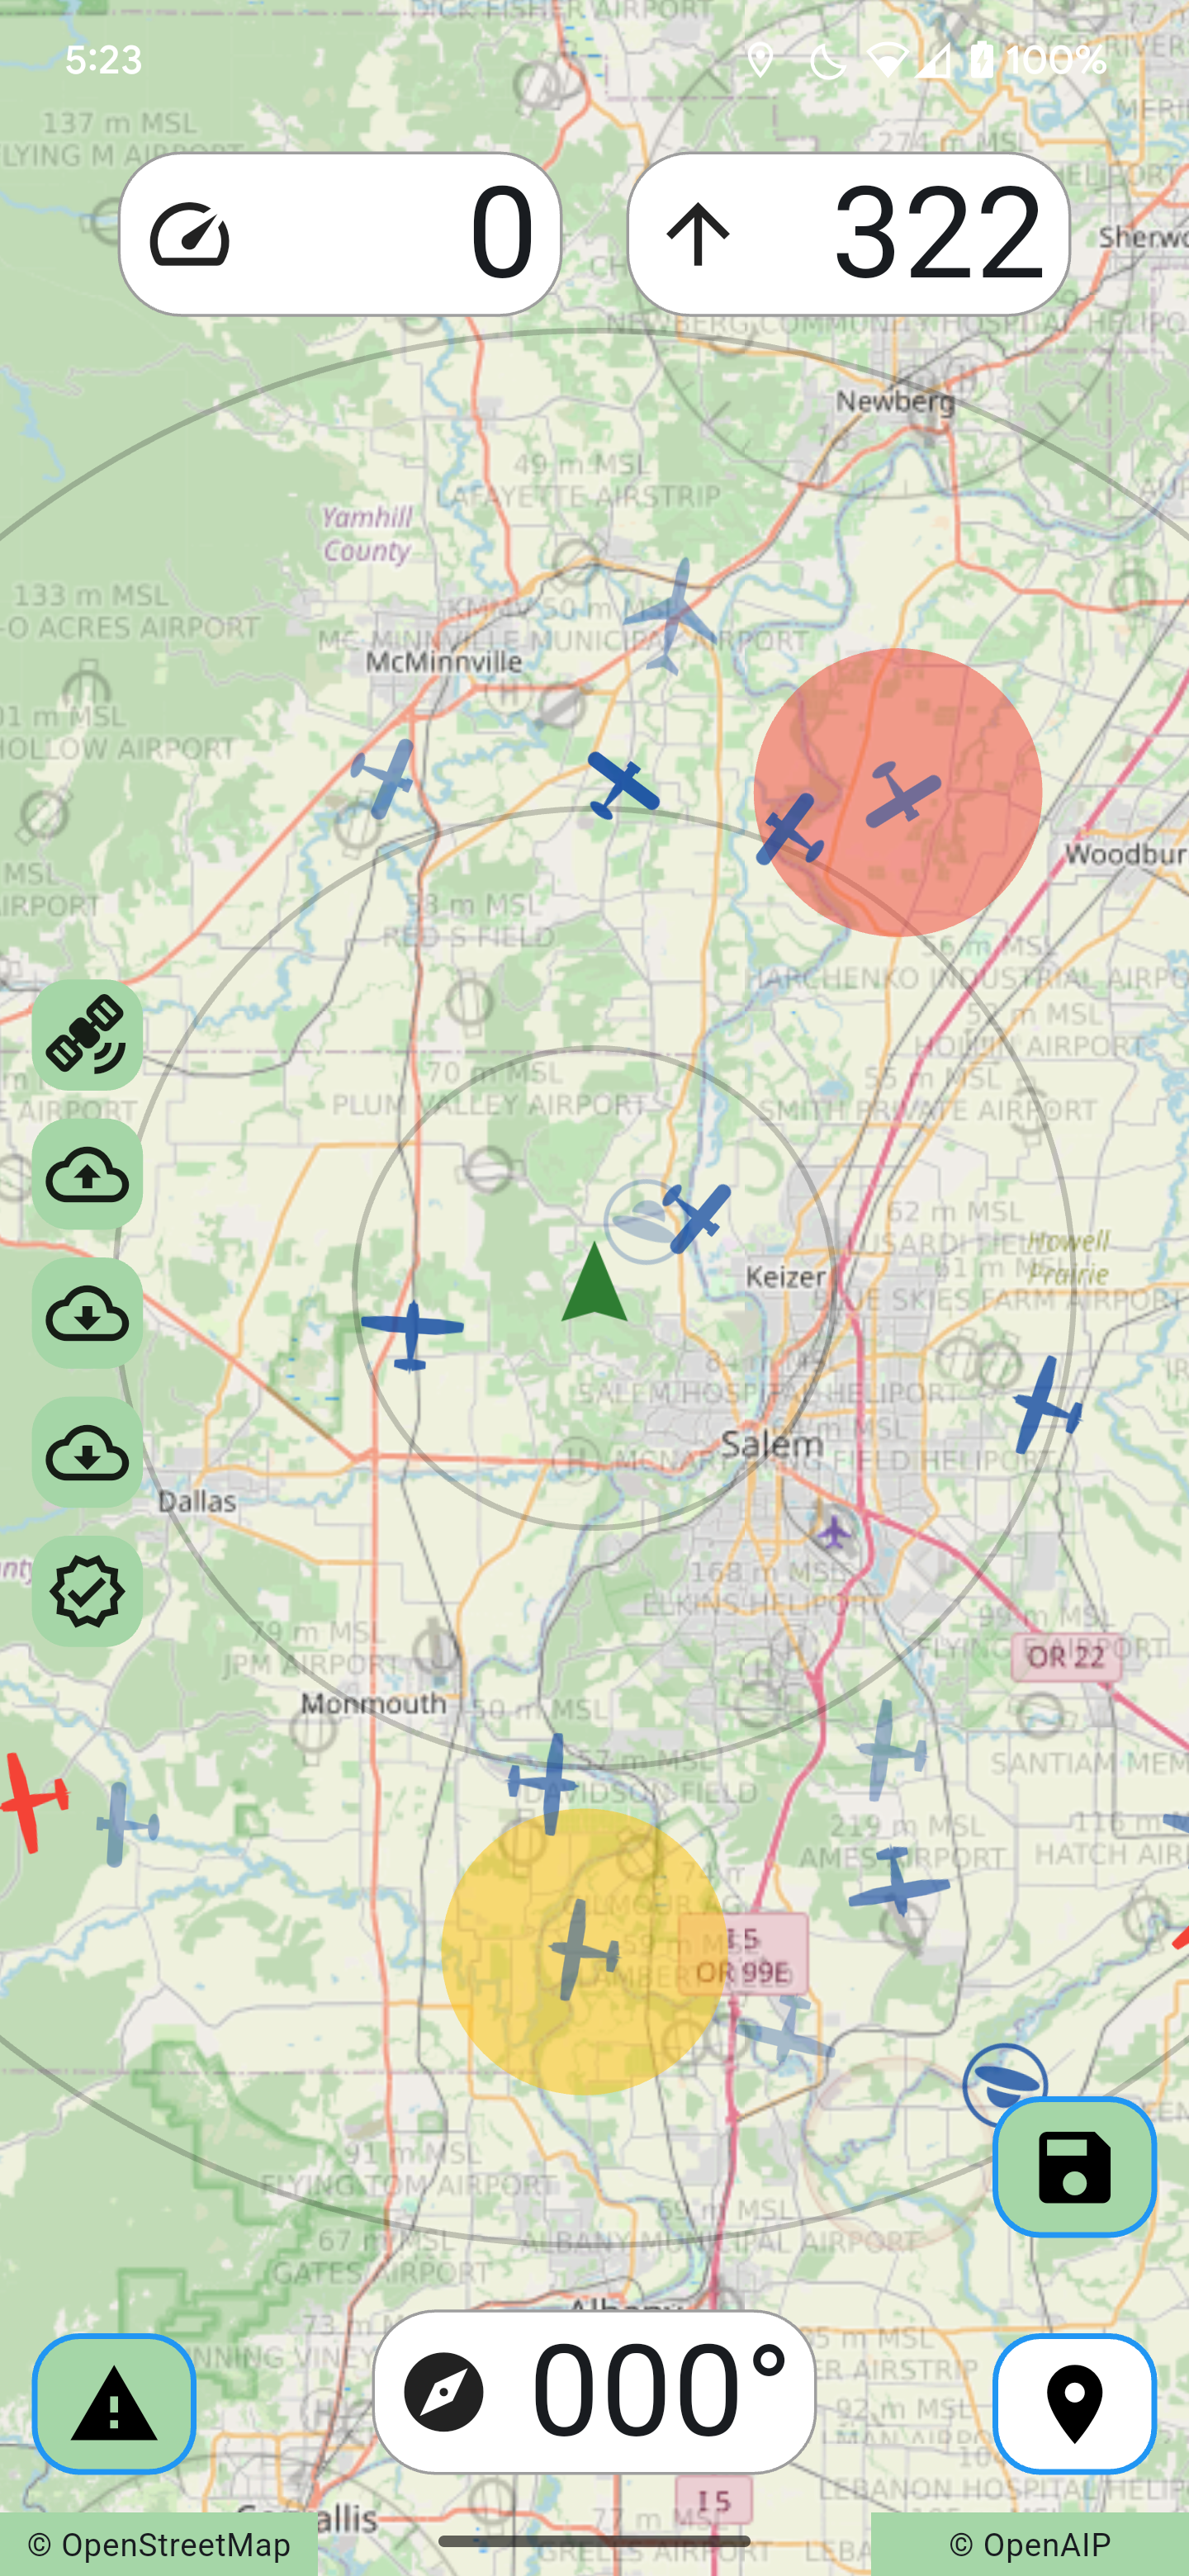
The Flight Display
The main Flight Display purposely has limited gestures. When bouncing around in an aircraft, having only a couple of things you can press is beneficial:
- You can pinch-zoom in and out.
- You can enable an alert.
- You can save the current recorded flight information.
On the Flight Display you can not pan off of the current position, intentionally. There is no recenter button typically seen on a moving map because one is not needed. Again, it is one less thing to correct when bouncing about.
And although it may be obvious, as shown on the Flight Display:
- Ground Speed (in knots).
- Altitude (in feet MSL).
- Bearing (degrees true).
- Distance and bearing to destination (when set).
These can be changed to Metric in the Settings.
Please note: Ground speed is not airspeed, and bearing (which way you are going) is not heading (which way you are pointing). These are not flight instruments, they are navigation instruments. But then, that is all you can get from a GPS.
The five round indicators on the left edge indicate:
- Receiving a GPS signal.
- Transmitting to ADS-IP.
- Receiving ADS-IP information.
- Receiving ADS-B information.
- This SimpleFly version is current.
Please note: ADS-B is being provided from an online source, not from official radio transmissions.
Switching Displays
At the bottom right of the displays is a flip-flop to switch between the Flight Display and the Navigation Display. By providing these two displays separately allows you to zoom into to a specific area on the Navigation Display (like the detailed information shown on a FAA sectional for your destination) and then flip back to the Flight Display without losing that view on the Navigation Display.
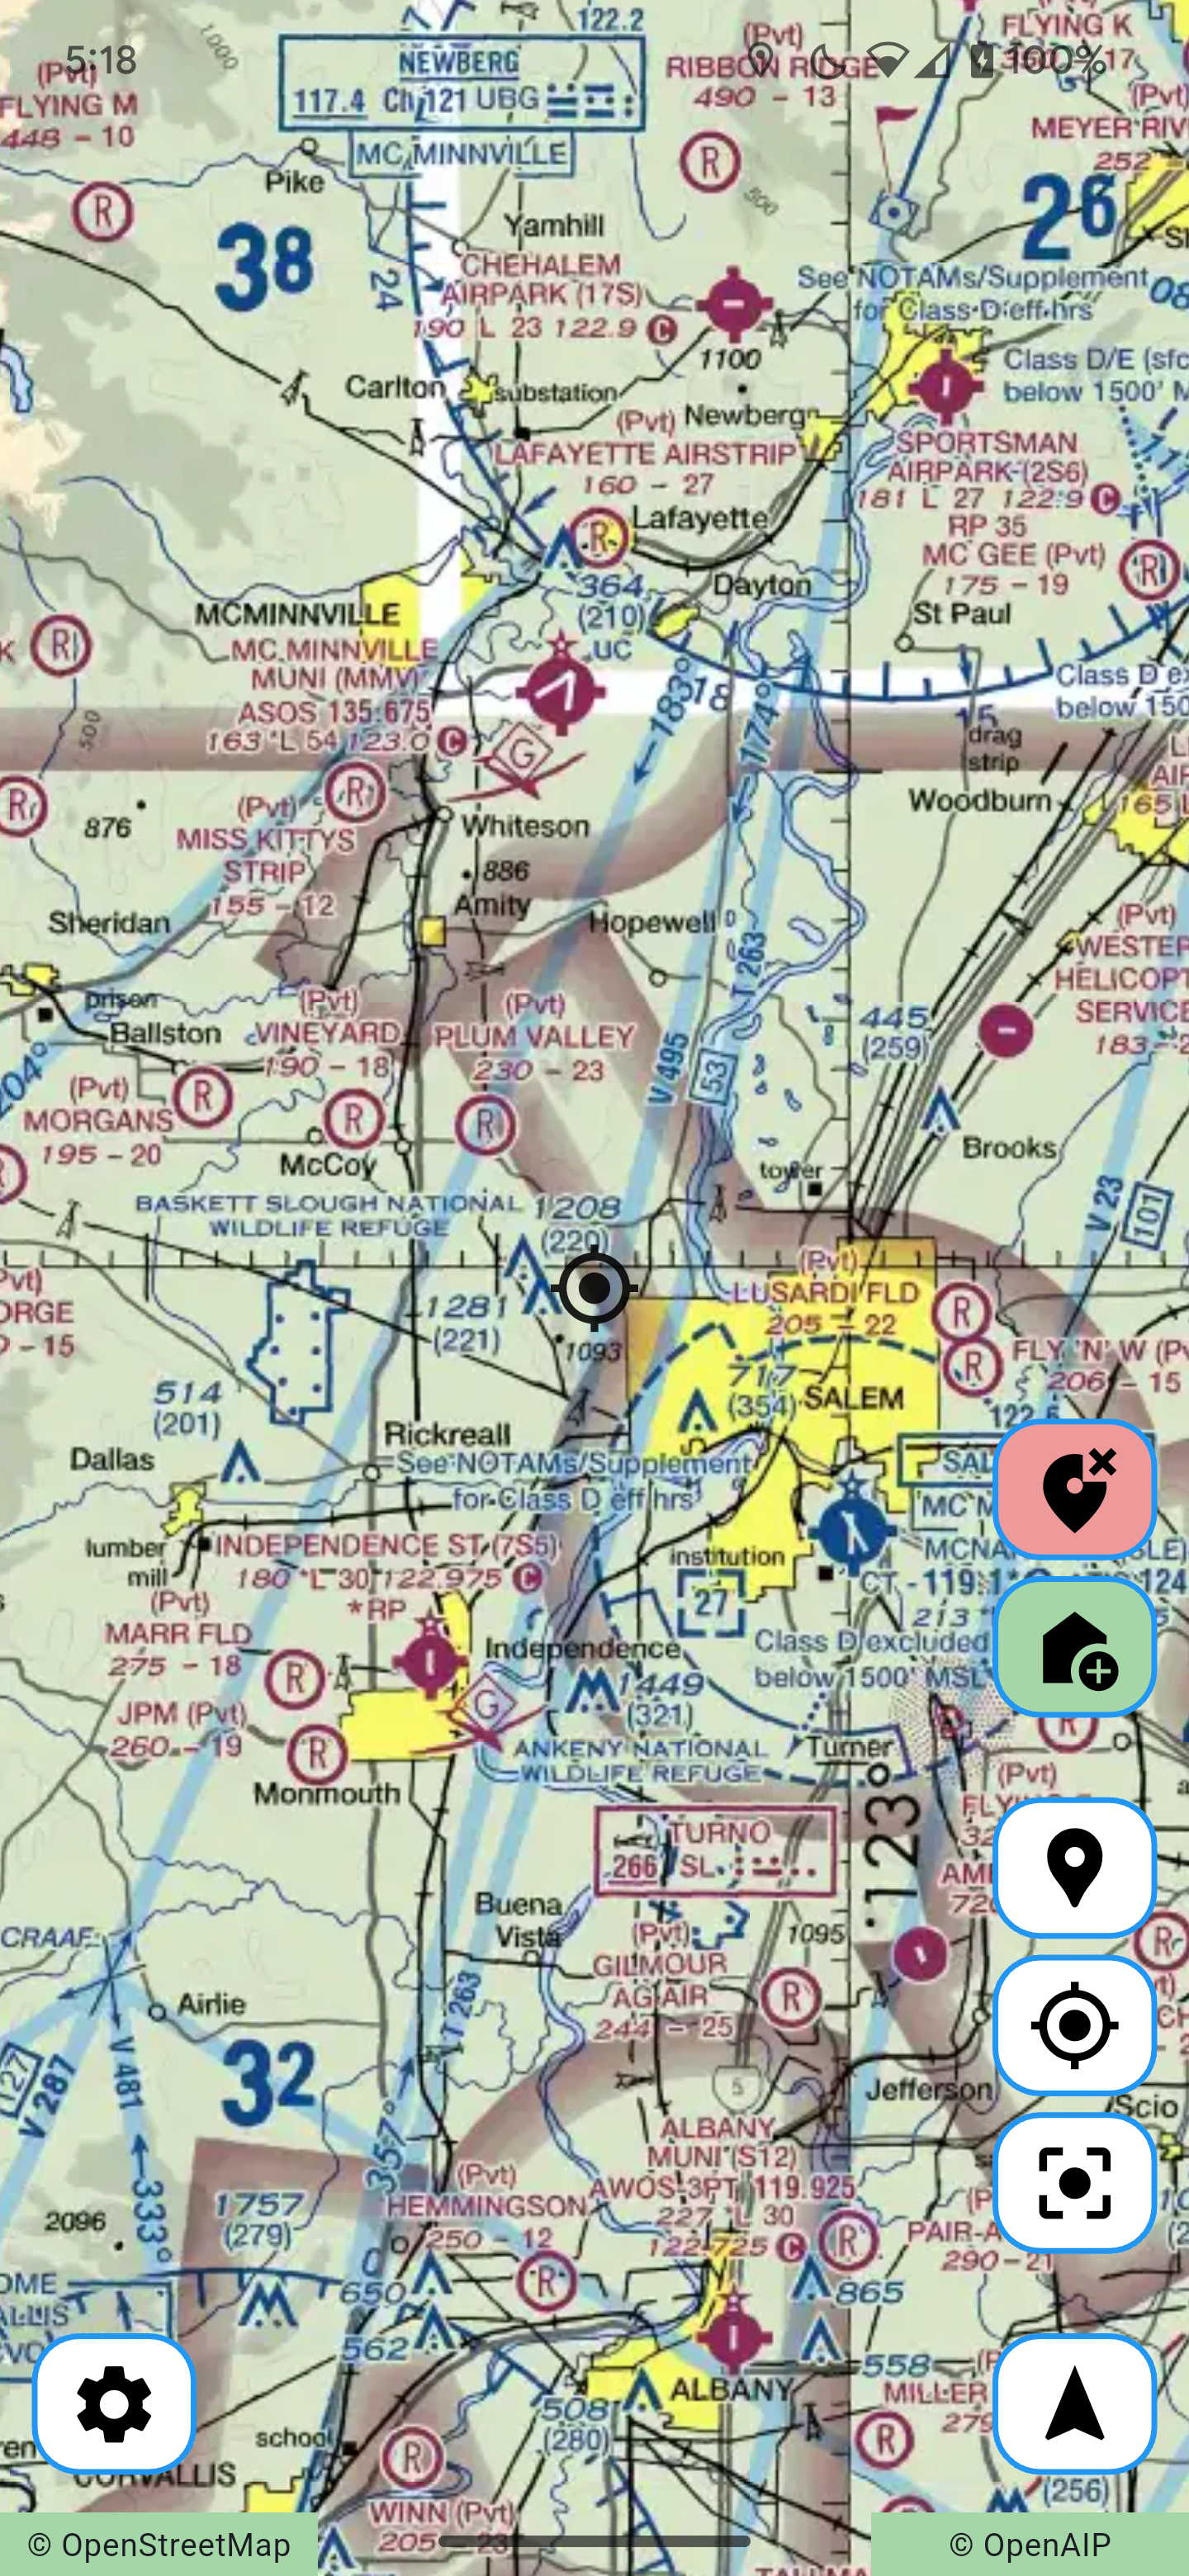
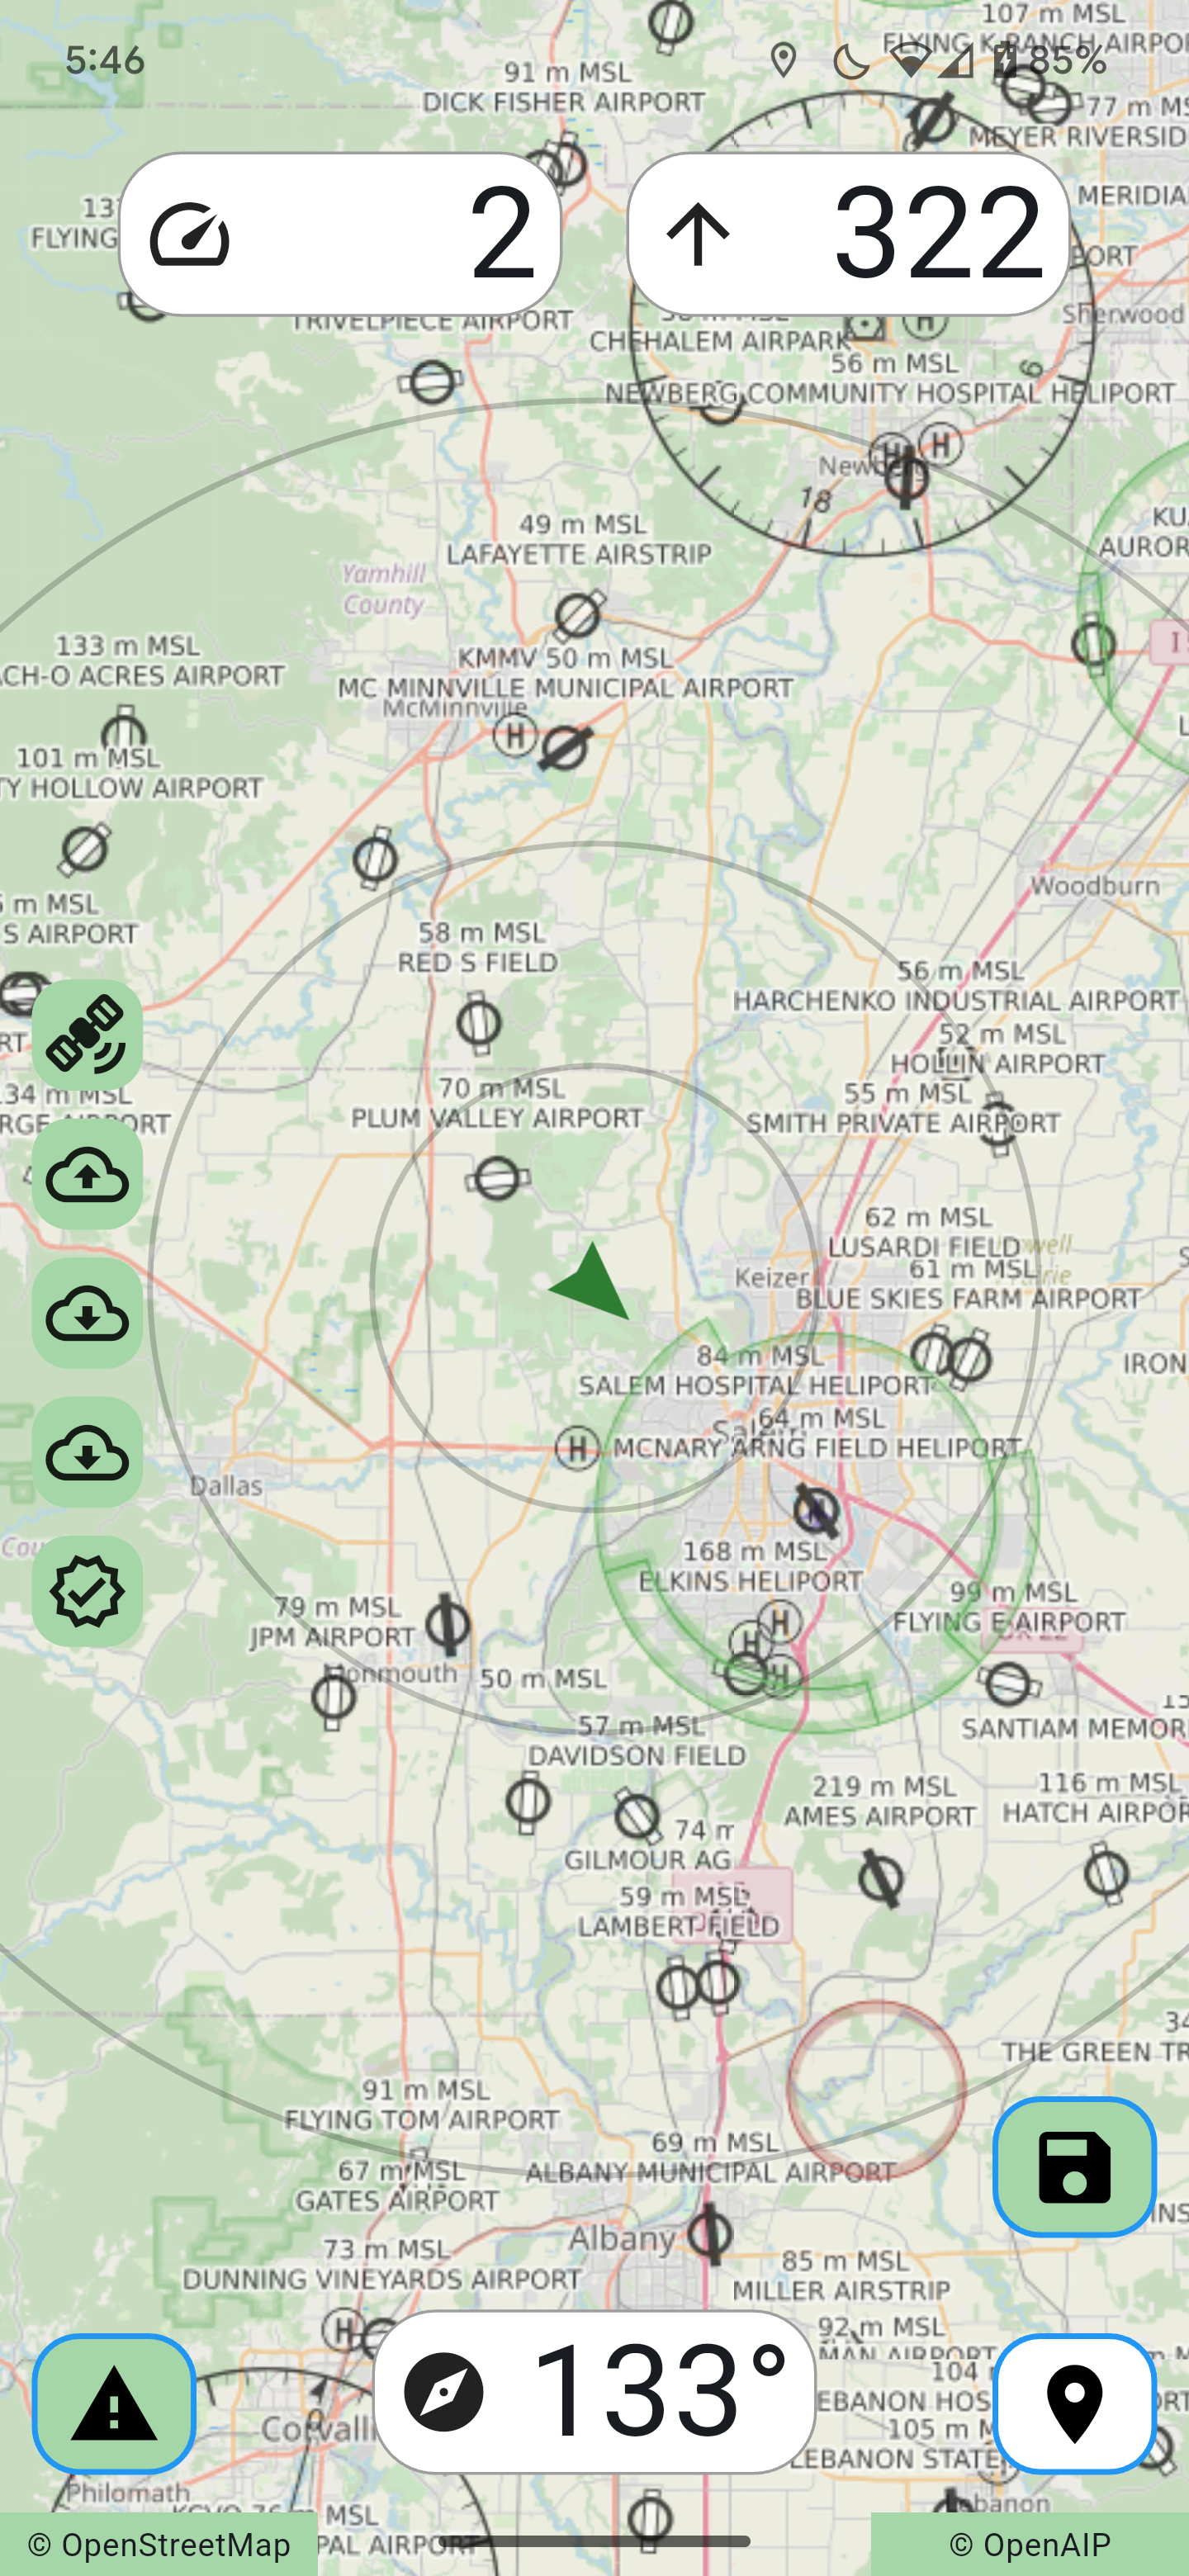
The Navigation Display
The Navigation Display has a bit more functionality:
- You can pinch-zoom in and out and pan.
- You can long-press to set a destination.
- There is a button on the bottom left for Settings.
-
The five additional buttons along the lower right allow you to:
- Clear the destination.
- Set the destination to Home, as determined by when the app was started.
- Zoom in to the destination.
- Center on the current position, at the current zoom.
- Zoom out to the current path.
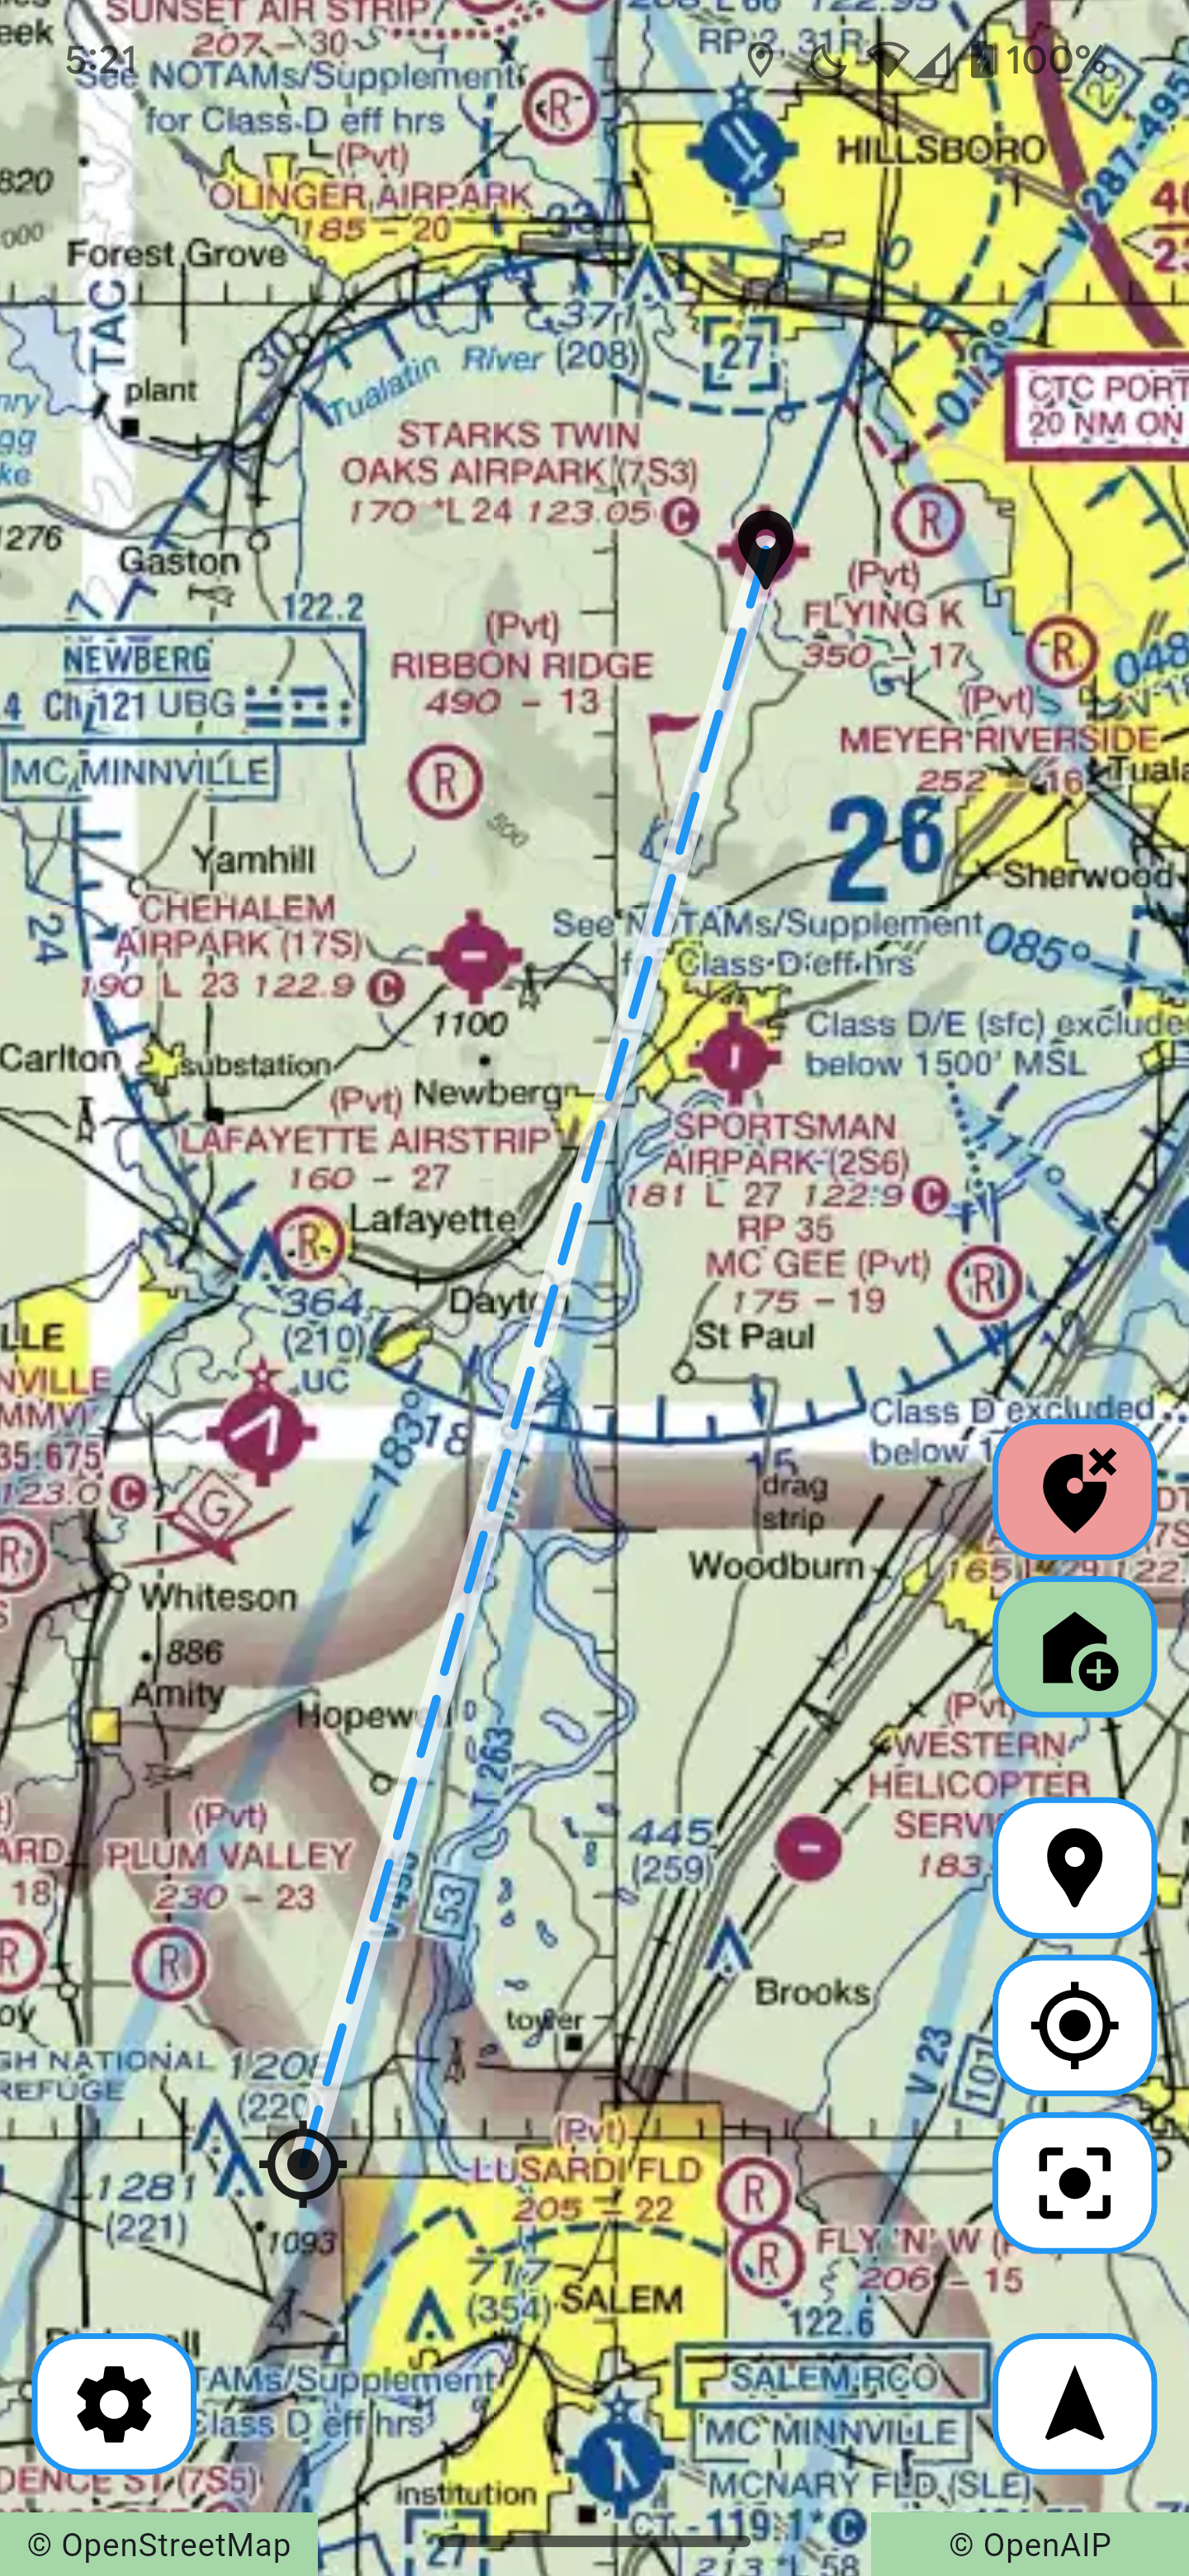
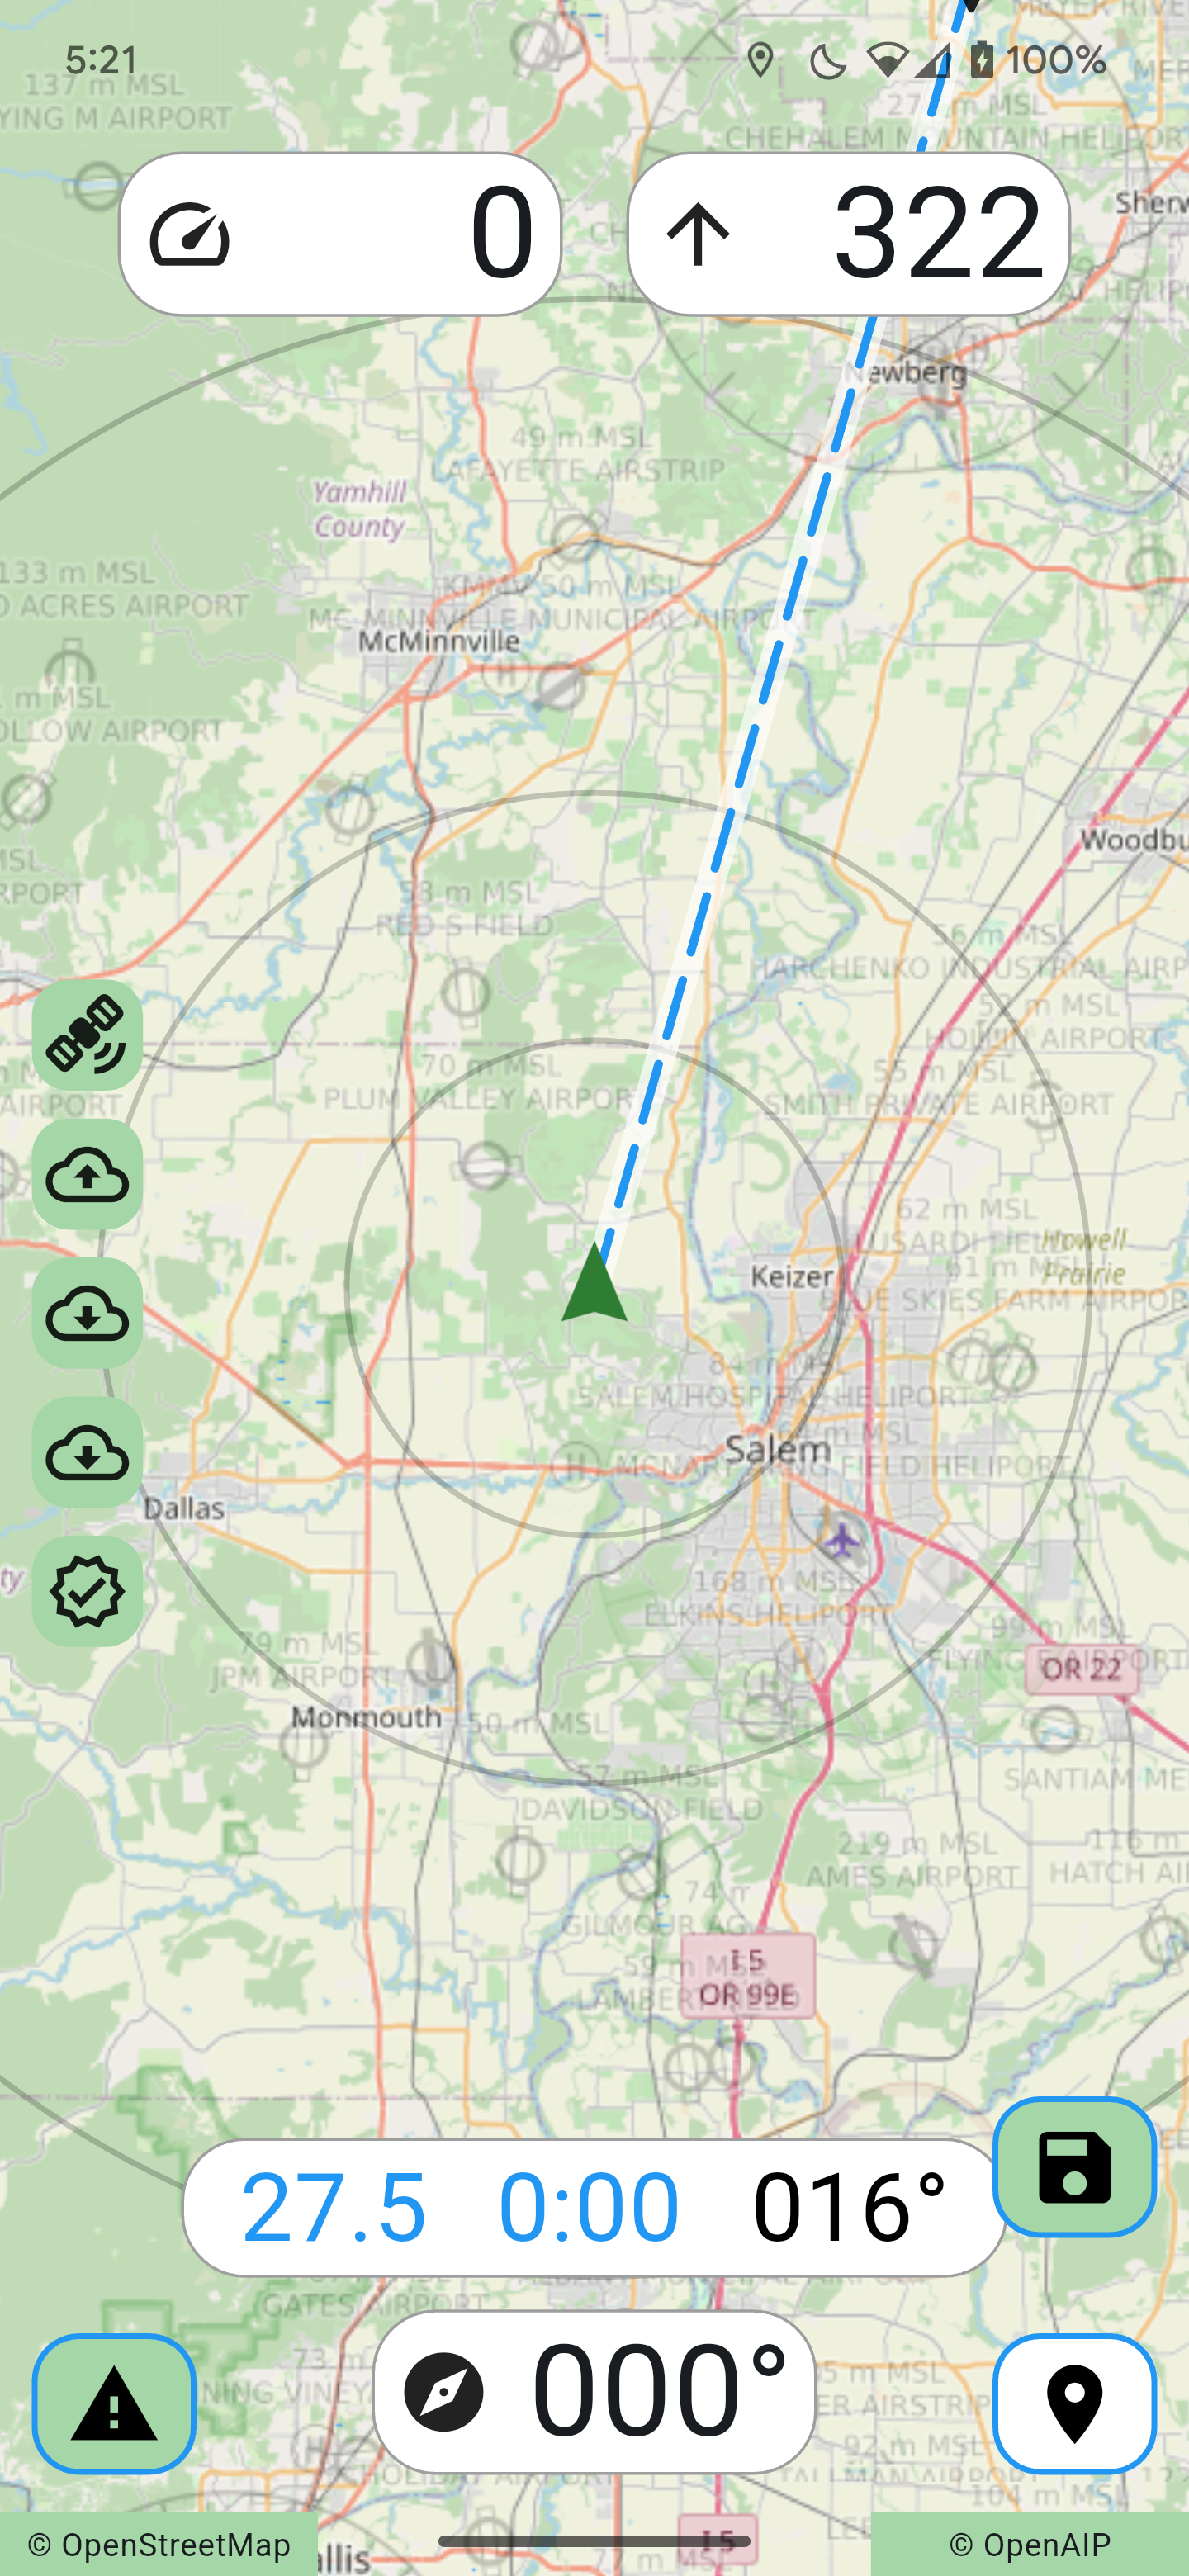
The Navigation Display (left) and Flight Display (right) after selecting a destination:
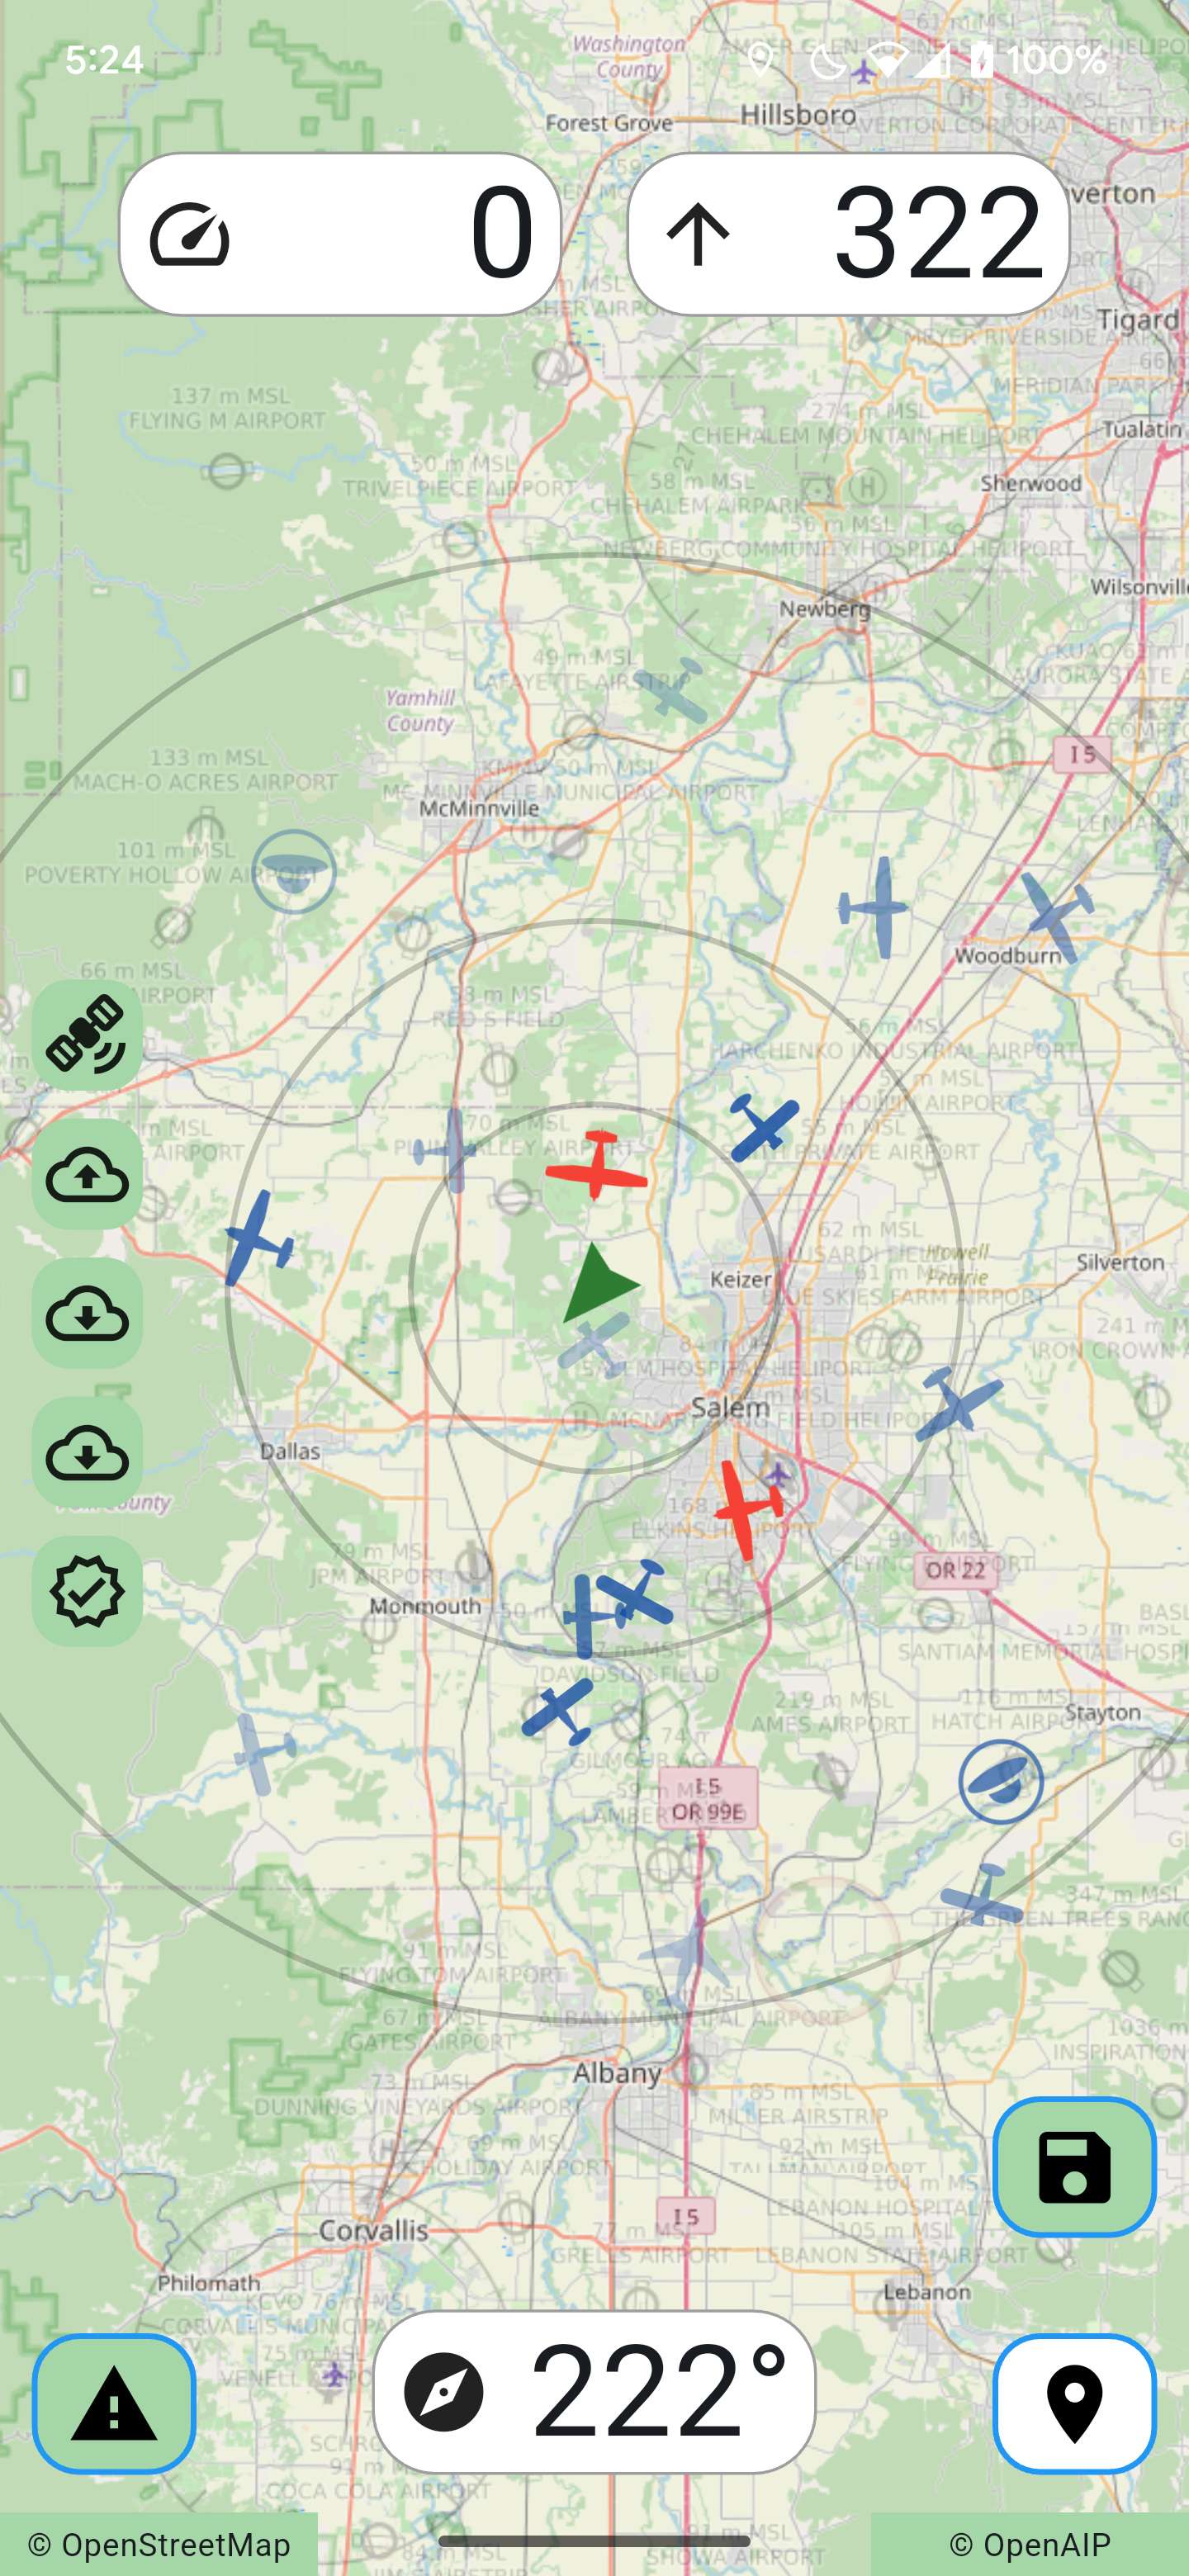
ADS-B Traffic
The app calls an ADS-B aggregator to acquire a list of other aircraft in the area. These are shown on the Flight Display as icons with the following color details:
- An aircraft above you is blue (blue skies above).
- An aircraft below you is green (green grass below).
- The further an aircraft is above or below you, they are more transparent.
- An aircraft within an altitude of about 500 feet of your altitude is red.
- An aircraft on the ground is shaded gray.
Additionally, the icons change based on the speed of that aircraft:
- Very fast aircraft (above 200 knots) are shown as jets.
- Fast aircraft (above 100 knots) are shown as 172's.
- Slow aircraft (below 100 knots) are shown as Cubs.
- Very slow aircraft (below 30 knots) or aircraft not reporting a speed are shown as UFO's.
The current ADS-B aggregator is adsb.fi. They are community-driven with open data. I have two ADS-B receivers feeding data to their network.
ADS-IP Traffic
The app uses ads-ip.net to acquire a list of other traffic using that system and to share your location on that system.
If your speed is over the Flight Started Speed and you have ADS-IP OUT enabled, your position will be continuously uploaded to ADS-IP. This allows others using ADS-IP to see you (similar to but not on the same system as ADS-B).
To summarize, this app shows both ADS-B and ADS-IP traffic. Both ADS-B and ADS-IP traffic is continuously downloaded from the internet, and that ADS-IP traffic can and should include you!
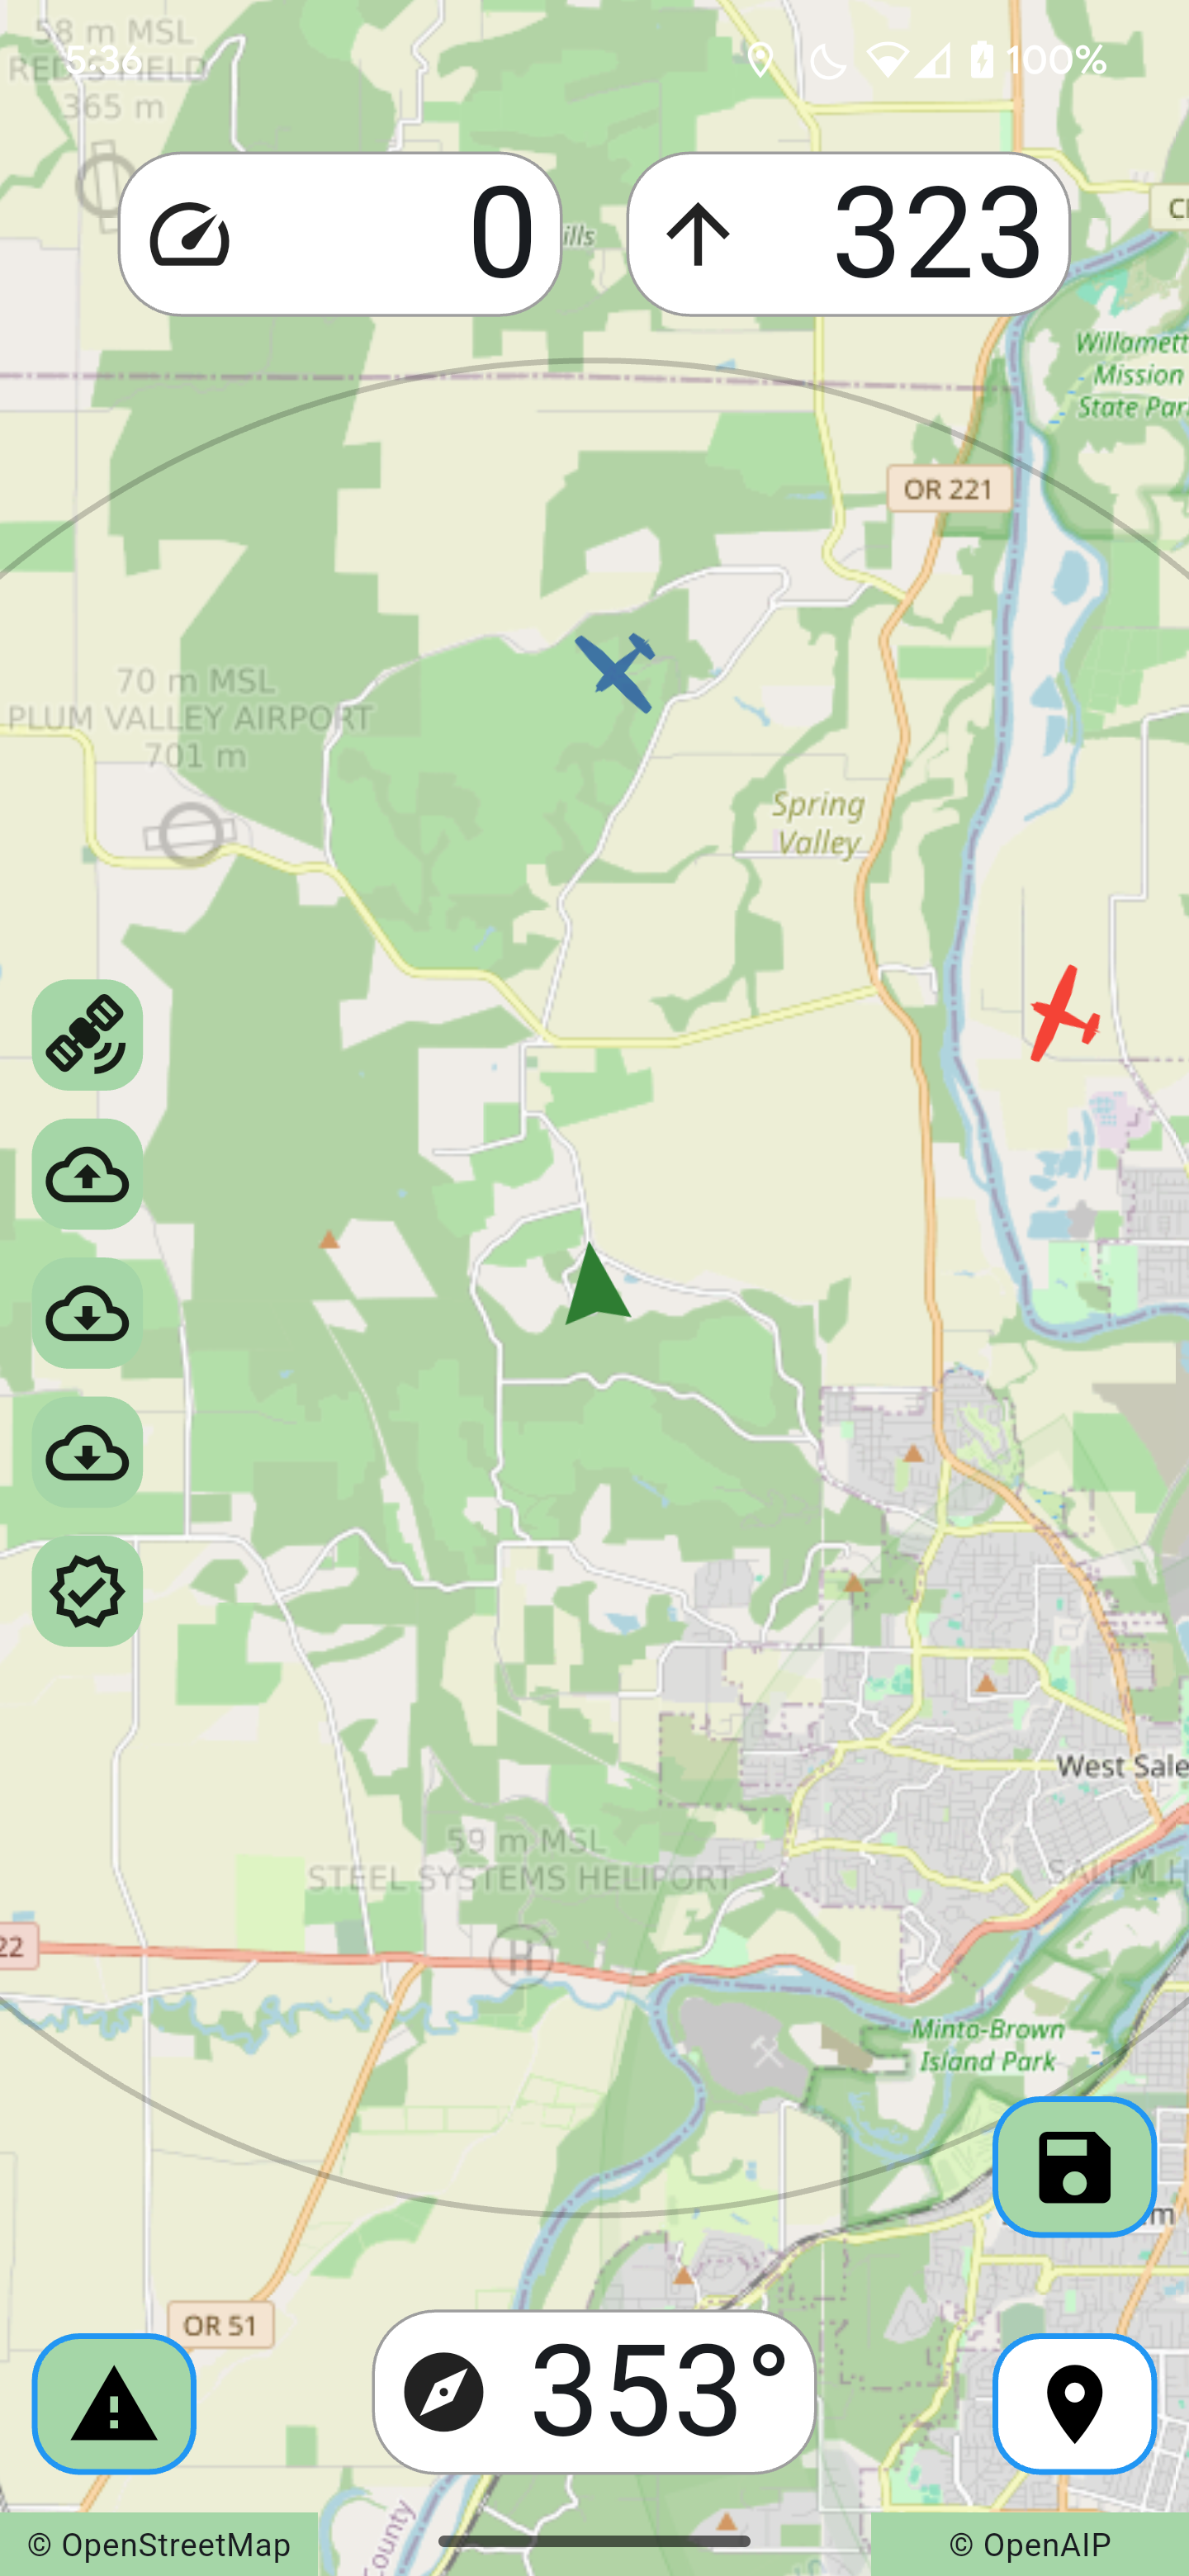
A typical Flight Display view (left) and zoomed out view (right) with ADS traffic shown:
Sending an Alert
The app can send an Urgency and Distress alert to the ADS-IP system.
- Single press the Alert button to toggle Urgency.
- Long press the Alert button to toggle Distress.
Please note: This is only being sent to the ADS-IP system. It will be the responsibility of the pilot to radio or phone official emergency services.
When signaling an alert, a notification will be shown on the Flight Display:
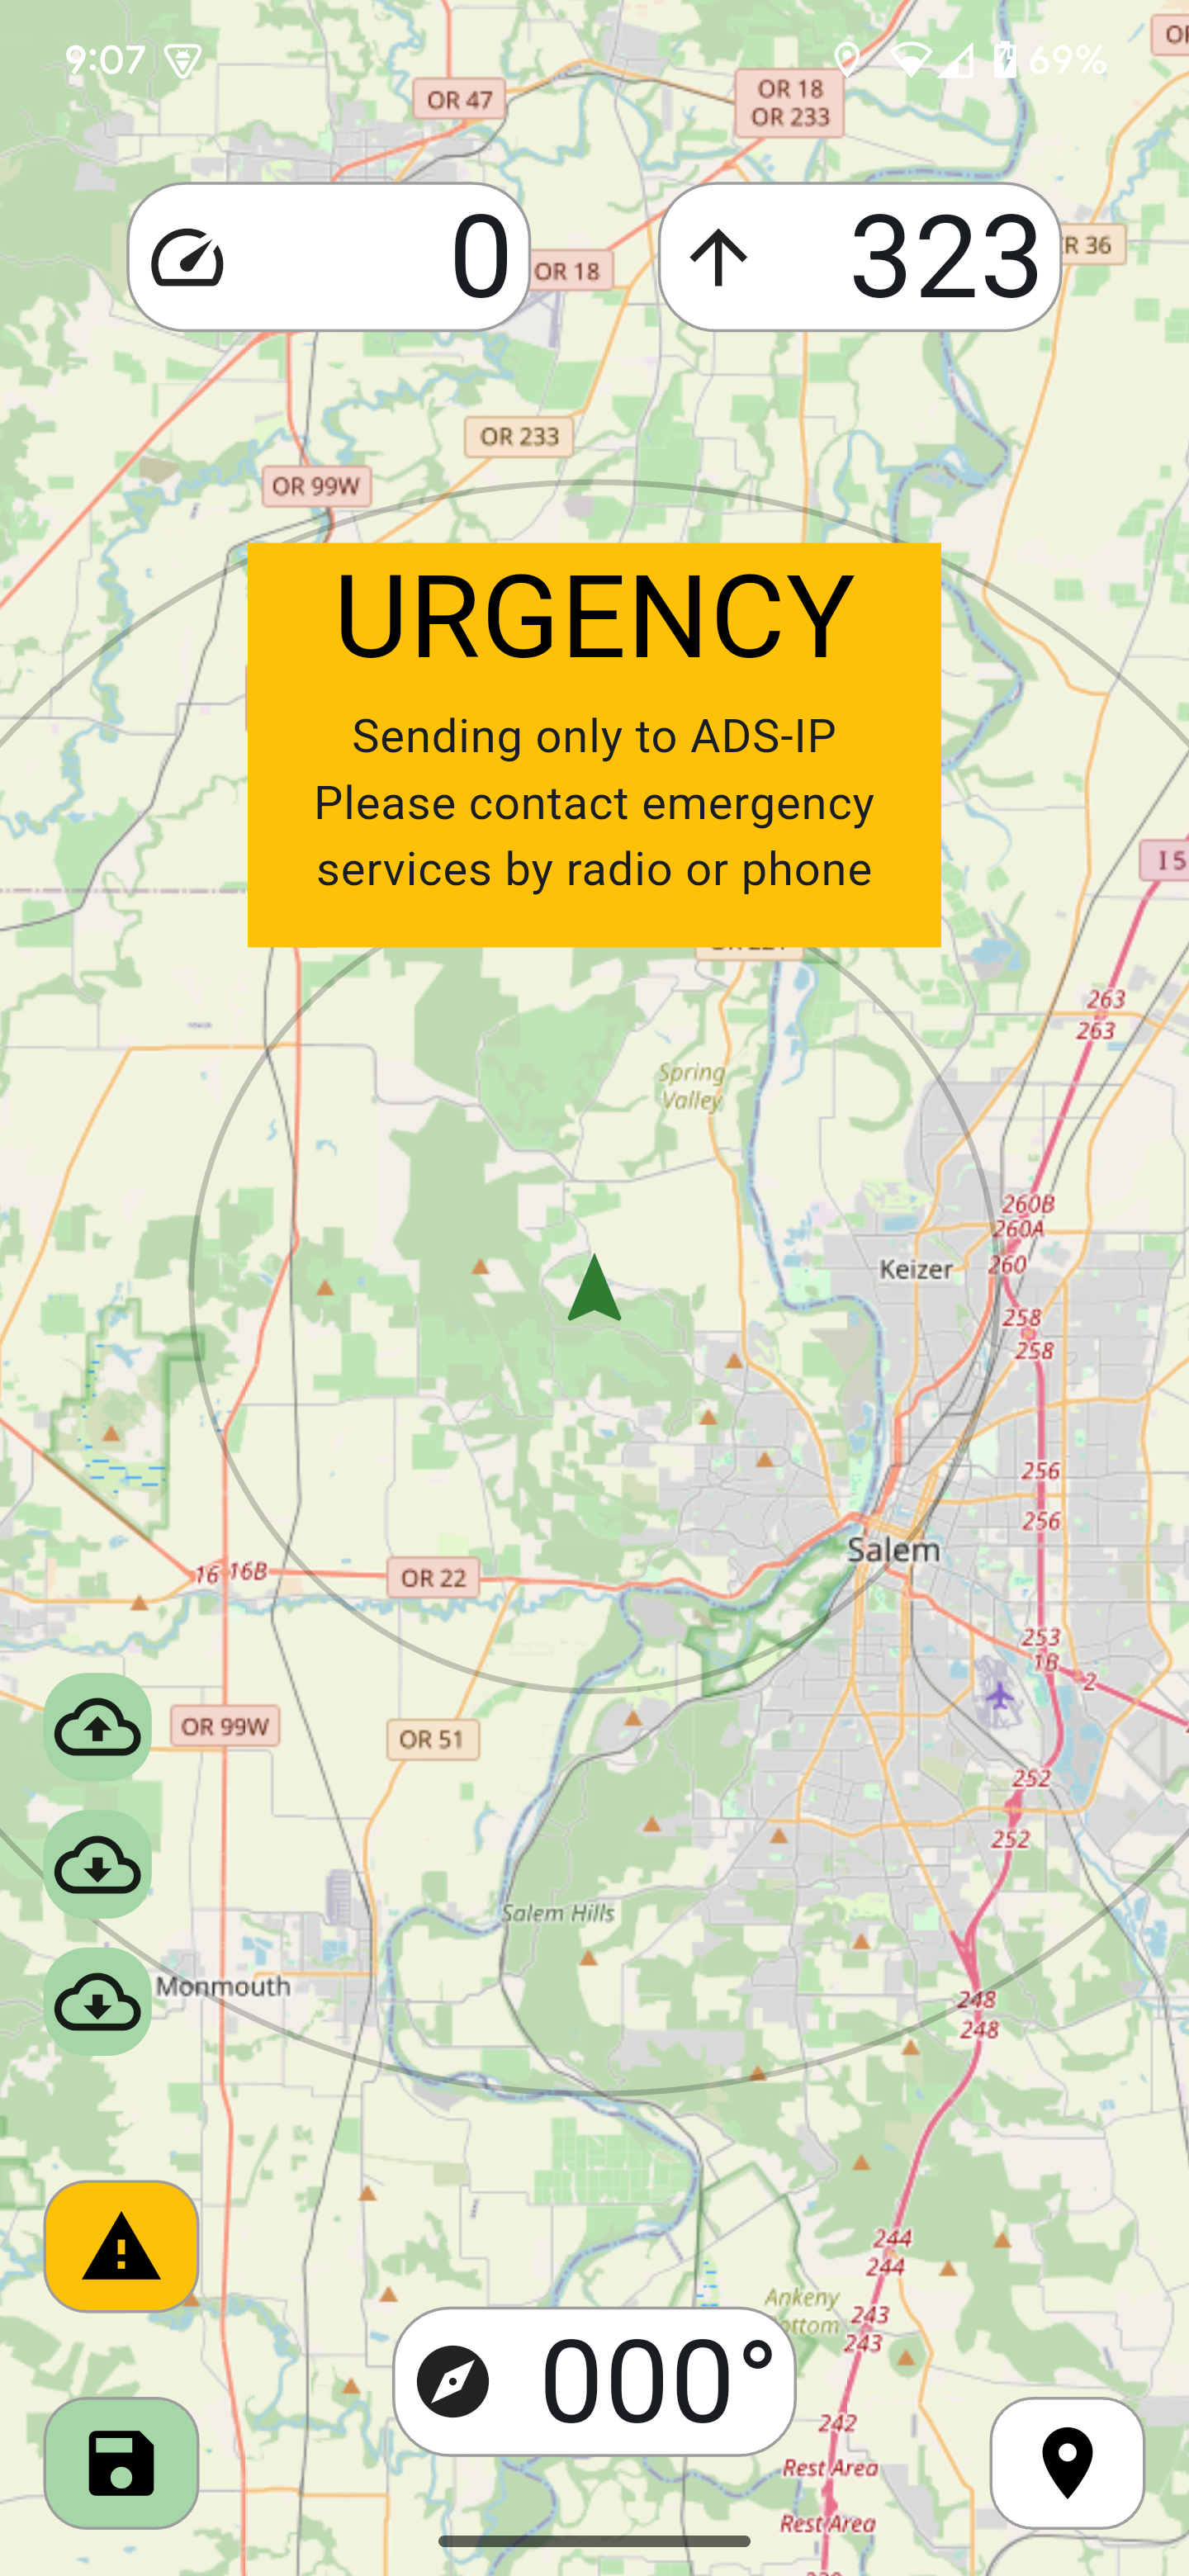
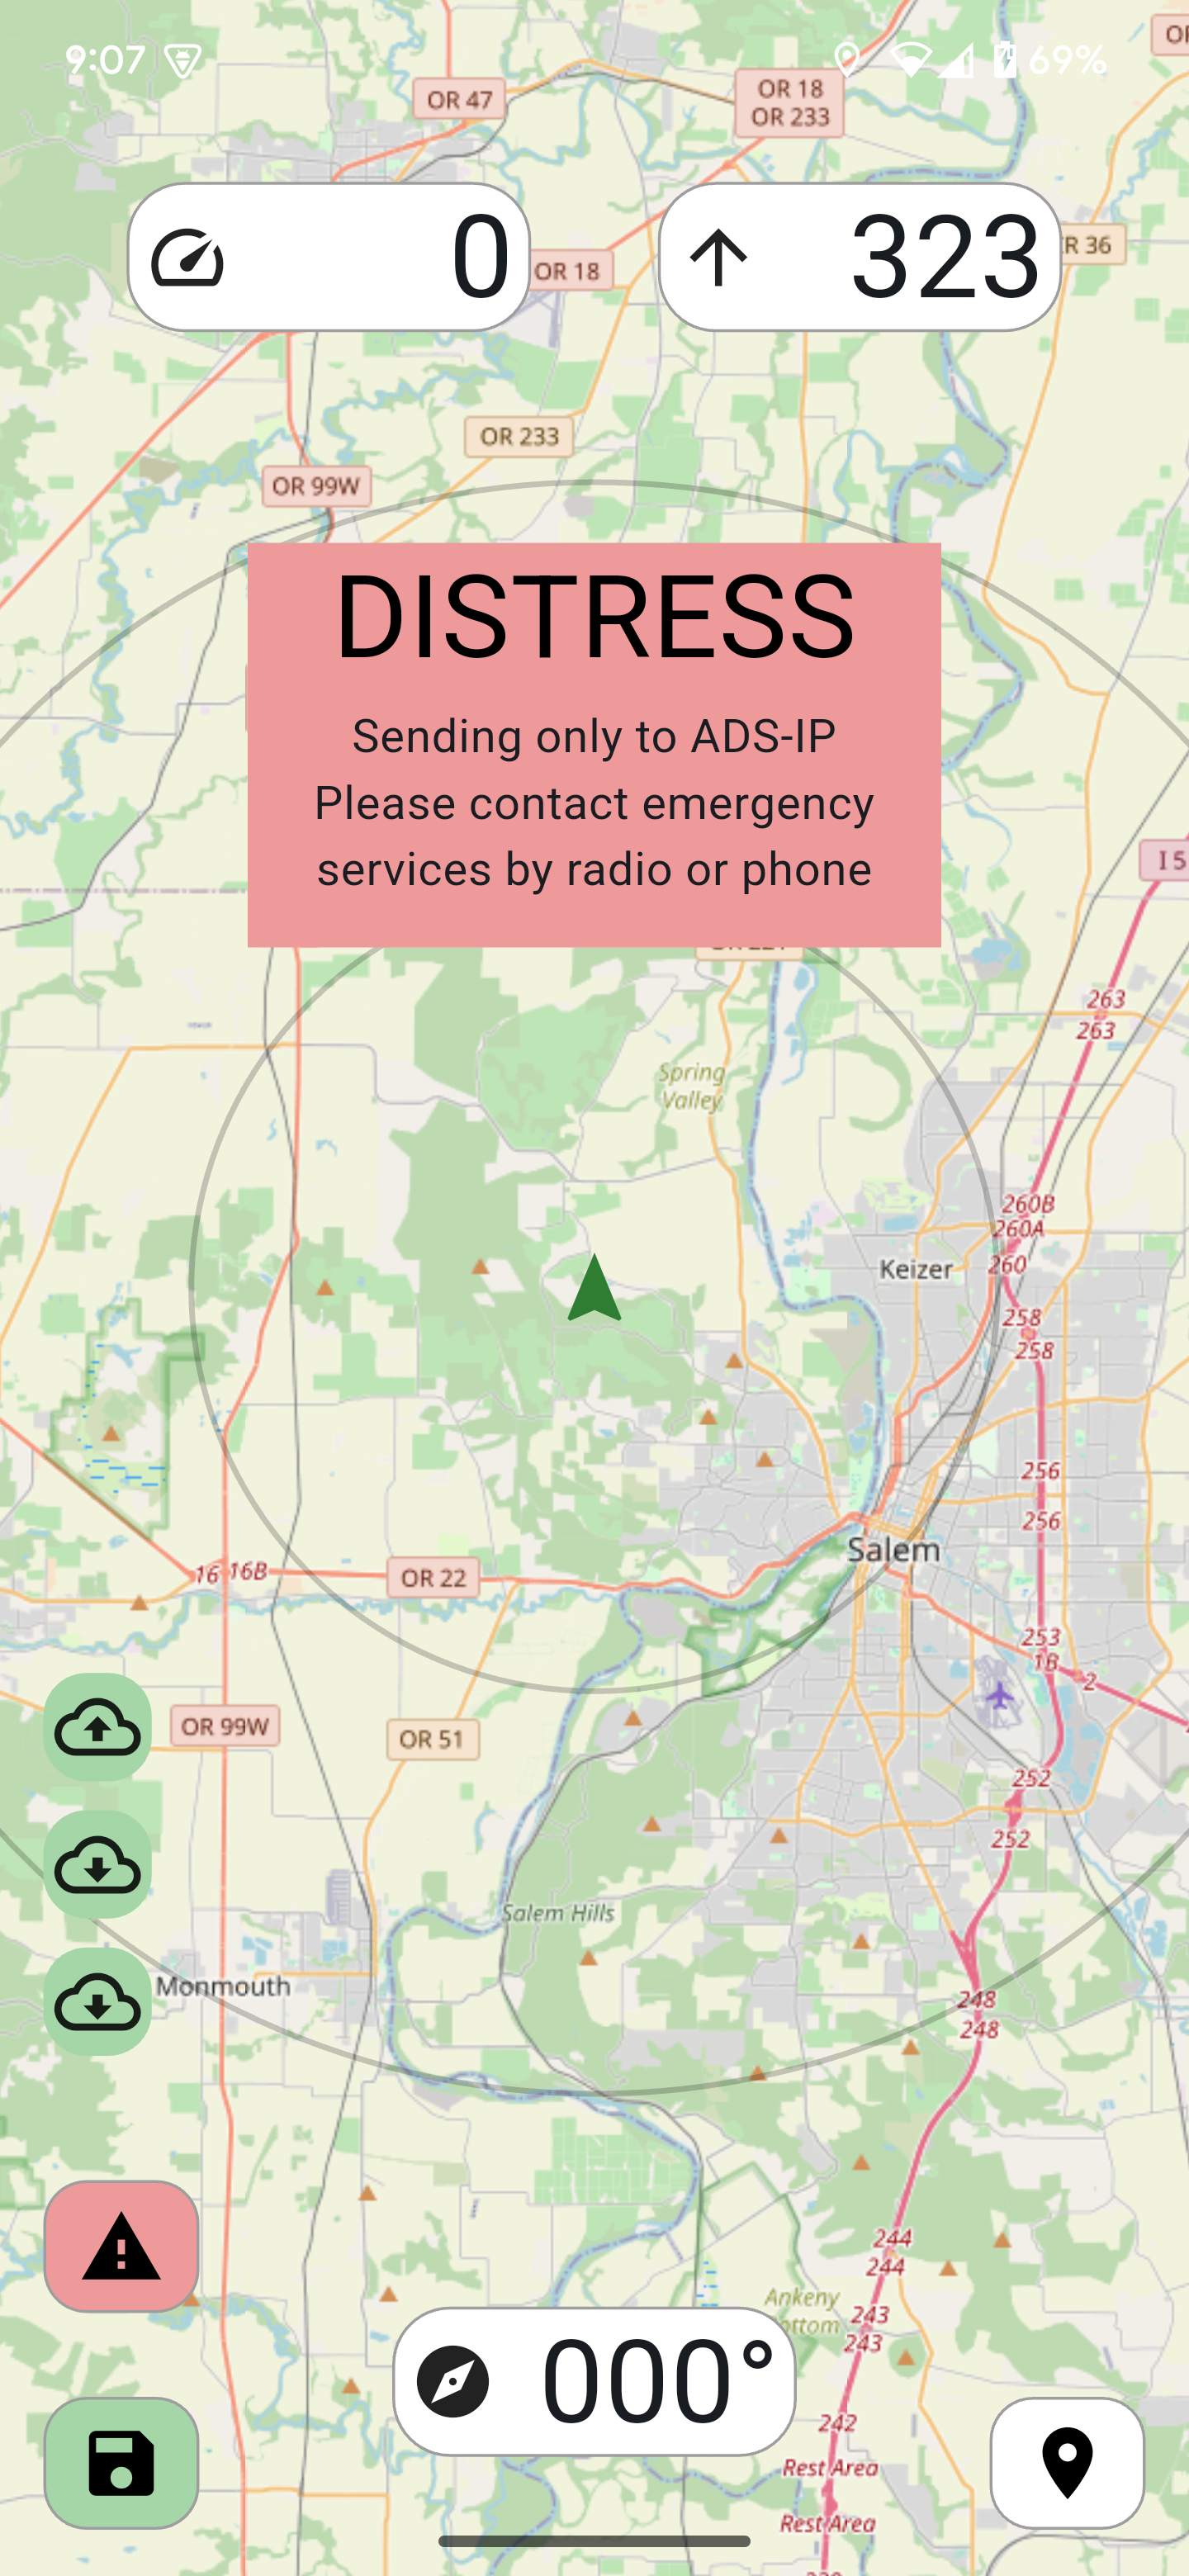
Currently, SimpleFly and the ADS-IP system use this information to display aircraft sending an alert. SimpleFly will show those aircraft highlighted with a circle in either amber (for Urgency) or red (for Distress).
Although this information is currently not being sent to an official safety watch system or to emergency services, it might be helpful when flying in a group or nearby others using SimpleFly. For instance, you may use the Urgency alert to indicate to others in your group that you are low on fuel (or whatever as agreed to in your pre-flight briefing).
Below is an example with one aircraft sending an Urgency and one sending a Distress:
The Flight Recorder and Saving a Flight
If your speed is over the Flight Started Speed, the flight recorder will periodically record your position.
The flight recorder can be turned on or off, or cleared from the Flight Recorder button on the Flight Display. The flight recorder can be used to provide you with a flight time, distance, and a file which can be used on a map to show your complete track.
The current recorded flight information can be saved by long pressing the Flight Recorder button. This is saved in GPS Exchange Format (GPX) and in Keyhole Markup Language (KML). These are saved, admittedly, in an unexpected location thanks to the complexity and security efforts of Android.
Saving and Finding the file:
- Long press the Flight Recorder button before you close SimpleFly.
- In Android, open Files.
- Navigate to All Storage > Internal Storage > Download.
- Find the files SimpleFly-{date}-{time}.gpx or ...kml.
At this point, use the three dot menu to the right of the file to Select, Share, Open, Copy, whatever. This type of file can be opened by many different mapping apps.
Using Google Earth
If you have the Google Earth app on your phone, then simply hit the three dots next to the KML file and Open With... Google Earth. This provides a nice visual of your flight.
Sharing with Others
You can share a link which will allow others to track you on a map in real-time!
- When you open SimpleFly, a pop-up will appear which asks you to share with others.
- If you click Share, it will create a link that you can use to share with whatever is on your phone (a text to any and all, an email, a post to social media, etc.)
- That link will take them to a map on ads-ip.net that follows your location.
You can also share your Flight Recorder's data file. This is very handy to simply share it with yourself!
- When you long-press the Flight Recorder button and save a file, or if you have been moving and your speed drops below the Flight Started Speed, a pop-up will appear.
- Just share it with your online drive, your email, etc.
- It will send a GPX file containing the Flight Recorder data.
Download SimpleFly
SimpleFly is free and requires no log-in, account, or submission of your email address. This is the fully functional version of the app; there is no free version with limitations tempting your to pay for a better version. There are no advertisements. The only tracking is anonymous electronic conspicuity provided to ADS-IP of which you can turn off.
Android
The following will start the download of the current release:
Download SimpleFly for Android
I respect your privacy and have not programmed any hidden tracking, hacking, or nefarious behavior in the app. However, it was written in Flutter (Google) using open-source Flutter libraries, and those things are out of my control.
This app is being provided outside of the Google Play Store. Your Android device will warn you and ask for permission to download and install it.
If you have previously download it, clear your browser cache before downloading an update. Some browsers simply use the cached file and you do not get the updated file.
IOS
The software was written to be compatible for both Android and IPhones. I even have a Mac and an IPhone just to be able to develop the software for you IOS users.
However, Apple has become a stickler about not allowing side-loading (The installation of an app on a phone without using the official Apple App Store). So I can not compile a stand-alone app package ready for you to download here, and your IPhone would not allow it to be installed anyway. They only allow apps filtered through the Apple App Store. And even after I go through Apple's paid process of becoming a developer, load it to the App Store, Apple still may not provide it to you if they determine it does not meets their standards or if it is simply not valuable. So I suggest the following...
Get an old Android Phone
Whether you are normally an Android user or an IPhone user, mounting a new phone to a vibrating vehicle (motorcycle, ultralight, airplane) risks damaging the phone's camera. New phones are pretty tough, but there is simply something with that level of vibration that destroys the mechanical parts of the camera.
So get an old or cheap Android phone. No Google account, no sim card, disable everything but Files, Clock, Chrome, and Settings. Then connect it to your actual phone using a WiFi hotspot. Your real phone is in your pocket, this one is running SimpleFly and mounted where you can see it.
Why leave Files, Clock, and Chrome? You need Chrome to navigate to WorktableCNC and download SimpleFly. You need Files to manage as necessary the saved flight information from SimpleFly. And you need Clock just in case you wanted to split-screen and have a timer or stopwatch visible.
Thanks to Open Source Maps
There are two open source maps being used as a default on the Flight Display:
- Open Street Maps provides the nice base layer showing trees, rivers, and roads.
- Open AIP provides the layer showing airports, airspaces, and TFR's.
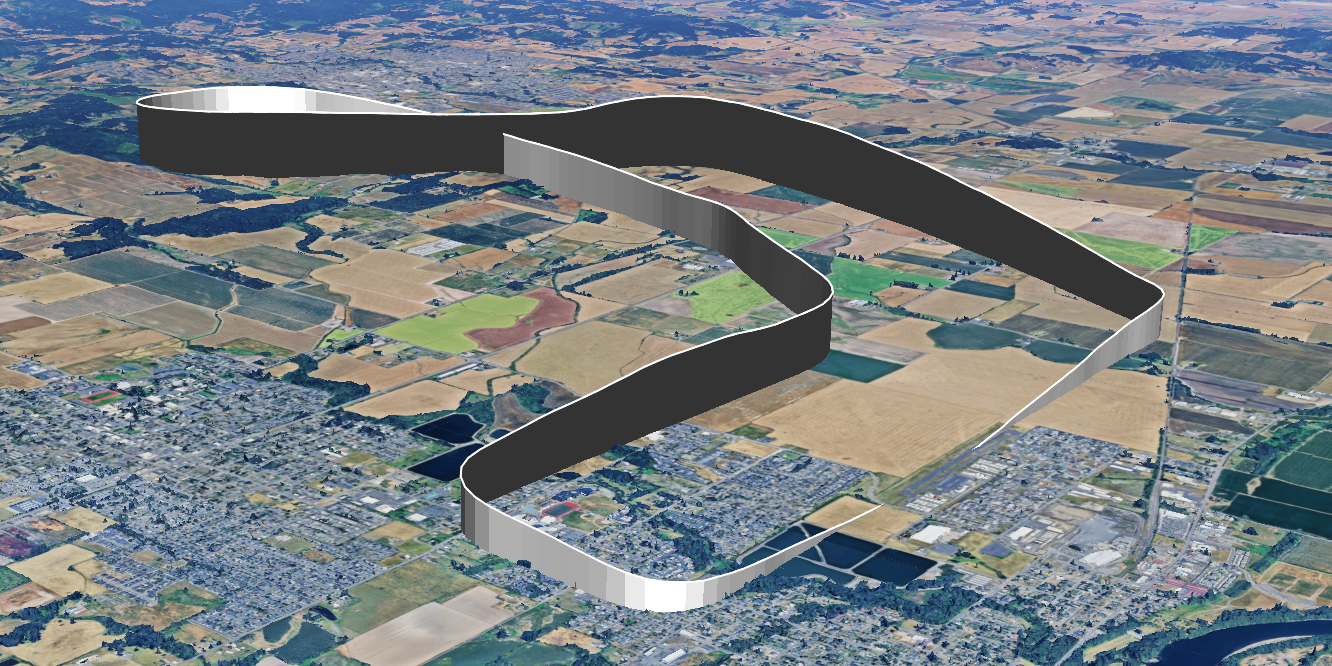
If you are using this app in the USA, then the Navigation Display will show FAA Sectionals. The original map TIF files were provided by the USA FAA, and then cut up into moving map tiles by WorktableCNC.
Thanks everybody!
Share This Page With Others!
Scroll down to here, show the person standing next to you, and let them scan it with their phone's camera. Easy!